Khan Academy on a Stick
Descriptive statistics
Measures of central tendency and dispersion. Mean, median, mode, variance, and standard deviation.
-
 Statistics intro: mean, median and mode
cc
Statistics intro: mean, median and mode
ccUsing the mean, median and mode to try to represent data
-
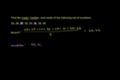 Example: Finding mean, median and mode
cc
Example: Finding mean, median and mode
ccMean Median and Mode
-
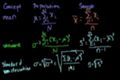
 Sample mean versus population mean.
cc
Sample mean versus population mean.
ccThe conceptual and notational differences between a parameter for a population and a statistic calculated from a sample.
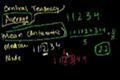
Measures of central tendency
This is the foundational tutorial for the rest of statistics. We start thinking about how you can represent a set of numbers with one number that somehow represents the "center". We then talk about the differences between populations, samples, parameters and statistics.
-
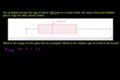 Reading Box-and-Whisker Plots
cc
Reading Box-and-Whisker Plots
ccReading Box-and-Whisker Plots
-
 Constructing a box-and-whisker plot
cc
Constructing a box-and-whisker plot
ccConstructing a box and whisker plot to analyze data.
-
 Box-and-Whisker Plots
cc
Box-and-Whisker Plots
ccBox-and-Whisker Plots
-
 Example: Range and mid-range
cc
Example: Range and mid-range
ccRange and Mid-range
Box-and-whisker plots
Whether you're looking at scientific data or stock price charts, box-and-whisker plots can show up in your life. This tutorial covers what they are, how to read them and how to construct them. We'd consider this tutorial very optional, but it is a good application of dealing with medians and ranges.
-
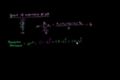
 Range, Variance and Standard Deviation as Measures of Dispersion
cc
Range, Variance and Standard Deviation as Measures of Dispersion
cc -
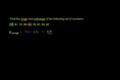
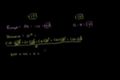
 Variance of a population
cc
Variance of a population
ccVariance as a measure of, on average, how far the data points in a population are from the population mean
-
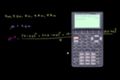
 Sample variance
cc
Sample variance
ccThinking about how we can estimate the variance of a population by looking at the data in a sample.
-
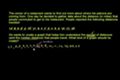
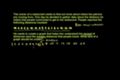
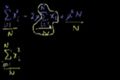
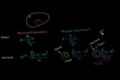 Review and intuition why we divide by n-1 for the unbiased sample variance
cc
Review and intuition why we divide by n-1 for the unbiased sample variance
ccReviewing the population mean, sample mean, population variance, sample variance and building an intuition for why we divide by n-1 for the unbiased sample variance
-
 Population standard deviation
-
 Sample standard deviation and bias
-
 Statistics: Standard Deviation
cc
Statistics: Standard Deviation
ccReview of what we've learned. Introduction to the standard deviation.
-
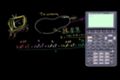
 Statistics: Alternate Variance Formulas
cc
Statistics: Alternate Variance Formulas
ccPlaying with the formula for variance of a population.
Variance and standard deviation
We have tools (like the arithmetic mean) to measure central tendency and are now curious about representing how much the data in a set varies from that central tendency. In this tutorial we introduce the variance and standard deviation (which is just the square root of the variance) as two commonly used tools for doing this.
-
 Statistics: The Average
cc
Statistics: The Average
ccIntroduction to descriptive statistics and central tendency. Ways to measure the average of a set: median, mean, mode
-
 Statistics: Variance of a Population
cc
Statistics: Variance of a Population
ccVariance of a population.
-
 Statistics: Sample Variance
cc
Statistics: Sample Variance
ccUsing the variance of a sample to estimate the variance of a population
Sal's old statistics videos
This tutorial covers central tendency and dispersion. It is redundant with the other tutorials on this topic, but it has the benefit of messy handwriting and a cheap microphone. This is Sal circa 2007 so take it all with a grain of salt (or just skip it altogether).